DNA Fund February Newsletter

Welcome to the monthly DNA Asset Management newsletter! As we approach the end of February, the crypto market appears fatigued, weighed down by ongoing liquidity extraction events. While altcoins and memecoins struggle under the pressure of capital outflows, Bitcoin remains resilient, driven by optimism surrounding potential regulatory advancements and broader institutional adoption. The DNA High Yield Fund is now live.

Recap of Markets in 2025
Bitcoin has shown little movement since the year’s start, while the broader crypto market has seen huge volatility, with altcoins fluctuating wildly and celebrity token launches siphoning liquidity from other memecoins.
In the days leading up to President Trump's second inauguration, he launched TRUMP token, which skyrocketed to a $14 billion market cap within 48 hours. Shortly after, Melania Trump’s Twitter account posted a wallet address for MELANIA token, which quickly surged to nearly $2 billion. These launches triggered a massive shift in liquidity, drawing funds away from other altcoins and memecoins. The primary exception was SOL, which saw a short-term influx of capital as traders bridged funds onto its blockchain. Within a week, Solana’s price soared from $170 to $295, marking a local top before retracing.
As momentum built around political and celebrity-backed tokens, other high-profile figures followed suit. Among them was Argentina’s president, Javier Milei, who endorsed LIBRA token, initially marketed as a funding mechanism for small businesses in Argentina. However, it quickly devolved into a memecoin-driven grift, with Kelsier Ventures and various KOLs orchestrating the play. Like TRUMP and MELANIA, Libra drained liquidity from existing altcoins and memecoins, exacerbating volatility in the broader market.
By early February, the crypto market experienced a sharp downturn despite Bitcoin holding above $90,000. SOL now faces an $2 billion token unlock on March 1, raising concerns over increased sell pressure. Meanwhile, grifters continue launching new tokens on Solana, further fragmenting liquidity. Adding to the chaos, Bybit—one of the largest centralized exchanges, holding $20 billion in assets— suffered a $1.5 billion exploit due to vulnerabilities in its signing procedures. Blockchain forensic analyst ZachXBT traced the attack to North Korea’s Lazarus Group. As uncertainty grips the market, Bitcoin remains resilient, but the broader altcoin sector struggles under the weight of liquidity drain and speculative mania.
The Institutionalization of Bitcoin as an Asset.
Bitcoin Finds PMF
Product-market fit occurs when a product effectively meets a strong market demand, demonstrating that it has successfully identified a viable target audience and delivered a solution to a real problem.
In this cycle, it has become increasingly evident that Bitcoin ("BTC") has achieved product-market fit. Unlike previous cycles, Bitcoin has outperformed nearly all other blue-chip digital assets and has consistently maintained a high share of the total cryptocurrency market capitalization—a metric known as Bitcoin dominance.
Since bottoming at approximately 39% in late 2022, around the period leading up to the FTX collapse, Bitcoin dominance has steadily increased. During this time, both Bitcoin and Ether (ETH) secured spot ETF approvals in the United States, leading to a surge in global adoption. This growth has been driven primarily by institutional fund flows, signaling a shift toward broader mainstream acceptance and reinforcing Bitcoin’s position as the leading digital asset.
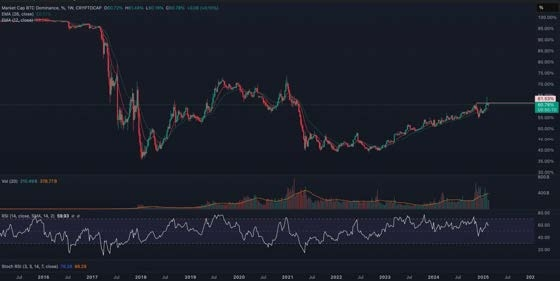
Source: Trading View - Bitcoin Dominance
While Bitcoin dominance has reached higher levels in the past, maintaining or increasing it has become more challenging in an environment where tens of thousands of new tokens launch daily—though 99% of these so-called “assets” hold little to no value. What makes Bitcoin’s strength even more remarkable is the broader market expansion. As seen in the chart below, the total market capitalization of all digital assets has surged from approximately $100 billion in early 2019 to $3.16 trillion today, reflecting an annualized growth rate of ~77.81%.
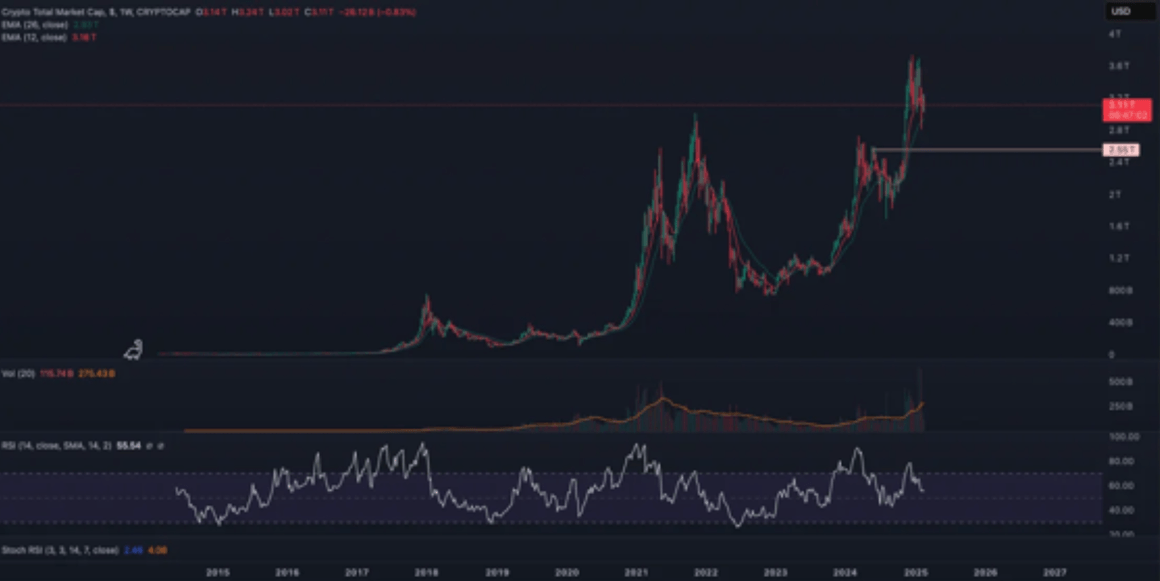
Source: Trading View - Total Crypto Market Capitalization
Over this same period, Bitcoin's Compound Annual Growth Rate (CAGR) has been an astonishing 74.6%, outperforming nearly every other asset valued in the billions. The only exceptions are NVIDIA and Tesla, which posted CAGRs of 82.4% and 153.31%, respectively, over the same timeframe.
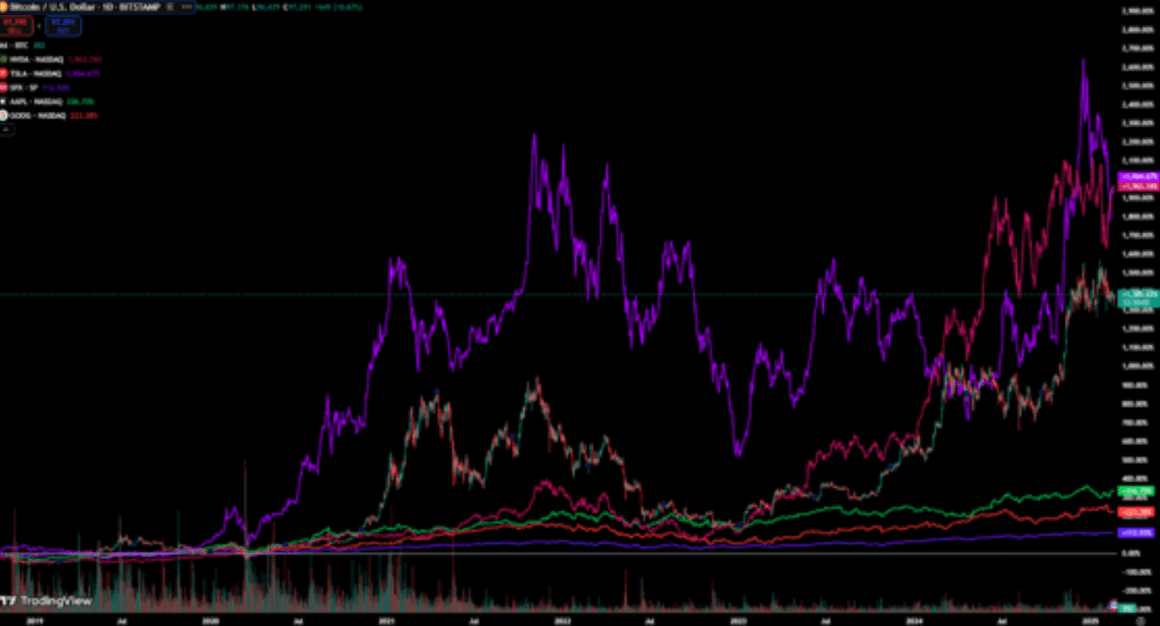
Source: Trading View - BTC vs. NVDA, TSLA, SPX, AAPL & GOOG (Since January
The Holy Grail
To fully grasp what it means for Bitcoin to have achieved product-market fit, we must first understand the long and arduous journey that led to the approval of a spot Bitcoin ETF in January 2024.
Like many others, I entered the market at the peak of the 2016 bull run, when Bitcoin surged from ~$400 in May 2016 to $18,000 by December 2017. At the time —and for the next seven years—the dominant narrative centered around the institutionalization of Bitcoin and the question of when it would finally trade in a spot ETF vehicle. This was widely considered the holy grail, the catalyst that would unlock institutional capital and propel Bitcoin from billions to trillions in market capitalization.
Achieving this, however, required an immense amount of structural and regulatory groundwork. Several key challenges had to be addressed before Bitcoin could be considered institutionally investable, including:
- Lack of reliable price oracles across exchanges
- Discrepancies in spot prices globally and across trading platforms
- Custody risks and security concerns
- Regulatory uncertainty and compliance hurdles
- Inefficiencies in spot vs. derivative market pricing
Evolving accounting standards for digital assets Solving these issues took billions of dollars in capital and the collective expertise of some of the sharpest minds in finance, law, politics, accounting, and computer science. But when everything finally aligned on January 11, 2025, the result was historic: the highest trading volume ever recorded for a first-day ETF launch.
Unlike many other high-growth assets that experience early momentum only to fade, Bitcoin's adoption has only accelerated. The chart below highlights daily inflows and outflows of all major U.S. spot Bitcoin ETFs, showcasing a consistently strend, with only minor seasonal slowdowns during the summer.
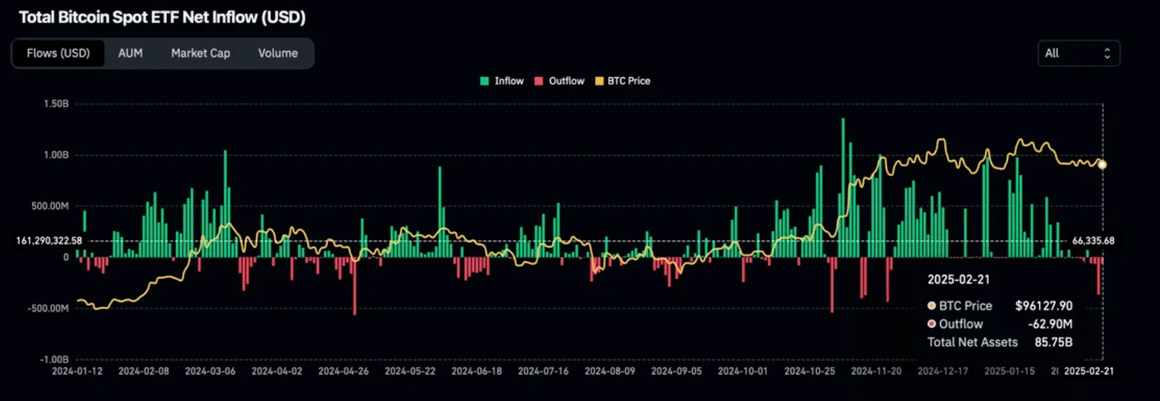
Source: Coinglass - Bitcoin ETF Flows
As someone who tracks the market daily, I was struck by the persistent buying pressure that seems to underlie current market conditions. Despite broader factors such as macroeconomic data, equity market movements, and multiple large-scale global conflicts, there is a continuous bid in the market. This raised the question: who is driving this demand? Is it primarily retail capital, or are new institutional players entering the space? And just how much of this buying can be attributed to MicroStrategy?
The Rabbit Hole of Buyers
To answer this question, I took a deep dive, and the DNA Asset Management team analyzed the latest 13F filings from some of the world’s largest asset managers. While the findings were somewhat expected, they were also revealing—not just in terms of what has already happened, but also in what they suggest about the path forward.
Michael Saylor has dominated headlines with MicroStrategy’s aggressive Bitcoin accumulation, having purchased 478,740 BTC for $31.1 billion, with plans to acquire an additional $2 billion in March 2025. However, this is just the tip of the iceberg when it comes to institutional buying.
According to Q4 2024 13F filings, 1,573 institutions reported long BTC exposure, primarily through ETF vehicles. This group includes major banks, endowments, sovereign wealth funds, and pension funds. Some notable disclosures include:
- Abu Dhabi’s Sovereign Wealth Fund reporting a $437 million BTC position
- Paul Tudor Jones’ firm, Tudor Investment Corp, holding $436 million in BTC exposure, making it their largest position
- The State of Wisconsin Investment Board with $321 million in BTC holdings
- Other notable firms with exposure include Millennium, Jane Street, DE Shaw, Susquehanna, Citadel, and Point72
This list represents some of the most sophisticated institutional investors in the world, underscoring how far Bitcoin adoption has progressed in a short time. In terms of portfolio allocation, the average BTC position across these 1,573 firms is just 0.13%. However, these figures are skewed by market-making, high-frequency trading, and arbitrage firms that hold only small positions to exploit inefficiencies rather than make long-term investments. Based on our estimates, roughly half of these institutions fall into that category, while the remaining firms that are truly long BTC hold an average position size of around 0.75% of their portfolios.
For institutions that view Bitcoin as a long-term investment, there remains significant room to increase allocations. Many have followed BlackRock’s suggested 1-2% allocation framework, but it is not difficult to envision a world where this grows to 5% or more for Bitcoin alone and 10% for crypto as an asset class, particularly as more ETF products gain approval.
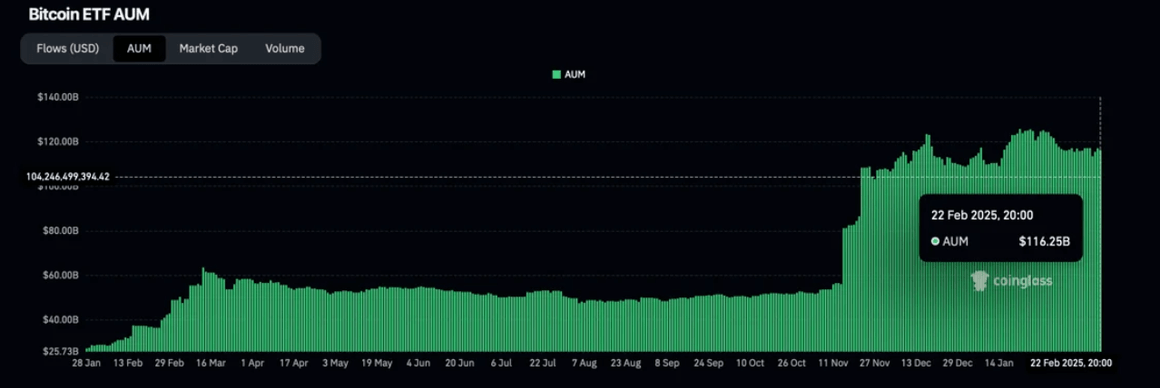
Source: Coinglass - Bitcoin ETF Cumulative AUM
Looking ahead, the key questions to consider are: What happens if the other 10,000 firms that file 13Fs start to follow suit and gradually allocate to Bitcoin? What about the remaining 195 countries around the world?
With a new crypto-friendly administration in place in the United States and increasing global recognition of Bitcoin as a hedge against inflation and fiat currency debasement, Bitcoin’s position has never been stronger.
Over the next four years under the current US administration, we expect to see dozens of additional digital assets securing approval for spot ETFs. It will be interesting to observe how these assets perform relative to Bitcoin and Ethereum, particularly given that Ethereum has lost significant purchasing power against Bitcoin since its ETF was approved on May 23, 2024, and began trading on July 23, 2024. Over a longer time horizon, the Ethereum ETF is likely to be a net positive, as it has already accumulated a solid $10.2 billion in assets under management across the major US spot ETFs.
YTD Token Returns:
BTC: +2.25%
ETH: -15.80%
SOL: -11.51%
Total Crypto Market Cap Excluding Top 10 ("OTHERS"): -20.21%
Top Crypto Equity YTD Returns:
COIN: -7.88%
MSTR: +1.16
GLXY: -12.10%
MARA: -14.42%
CORZ: -23.91%
WULF: -24.16%
HUT: -16.47%
BTBT: -11.54%
For more information on DNA, our funds, or for investment inquiries, please contact us at, am@dna.fund